The introduction of the automated balls and strikes (ABS) challenge system at the Major League level is the biggest change in umpiring since we began tracking umpires – and it reshapes how we think about our work in a number of ways, which we've outlined below. While we're excited about what we've built so far, much of this is genuinely new, and we expect our approach to evolve as we learn more about how ABS plays out in the regular season.
What is a strike?
In the pre-ABS era, the exact boundary of the strike zone was subject to umpire discretion: there was variation between umpires, between games from the same umpire, and even between pitches in the same game (hence our measure of consistency). It was ambiguous whether the strike zone was 2- or 3-dimensional (and if it was 2-dimensional, where the plane was). And most importantly, there was no mechanism for correction: there was no ground truth against which to measure ball and strike calls.
To measure umpire accuracy, we chose to use a 2-dimensional strike zone, measured at the front of the plate. We chose this definition because it matched our normative understanding of what the strike zone is (it matches what is on TV broadcasts and the Gameday app, for instance) and because it’s relatively easy to compute. Recognizing that this strike zone was not necessarily the strike zone, we used a probabilistic model of umpire accuracy and only penalized umpires for near-certain errors; that is, we effectively gave umpires a margin of error in our model.
But strike zones are now standardized: they are exactly 17 inches wide, the top of the zone is exactly 53.5% of a player’s height, and the bottom is 27% of the player’s height. The location of the ball is measured as the ball crosses the center of the plate, exactly 8.5 inches from the plate’s front and back. And there appears to be no margin of error in MLB’s challenge system.
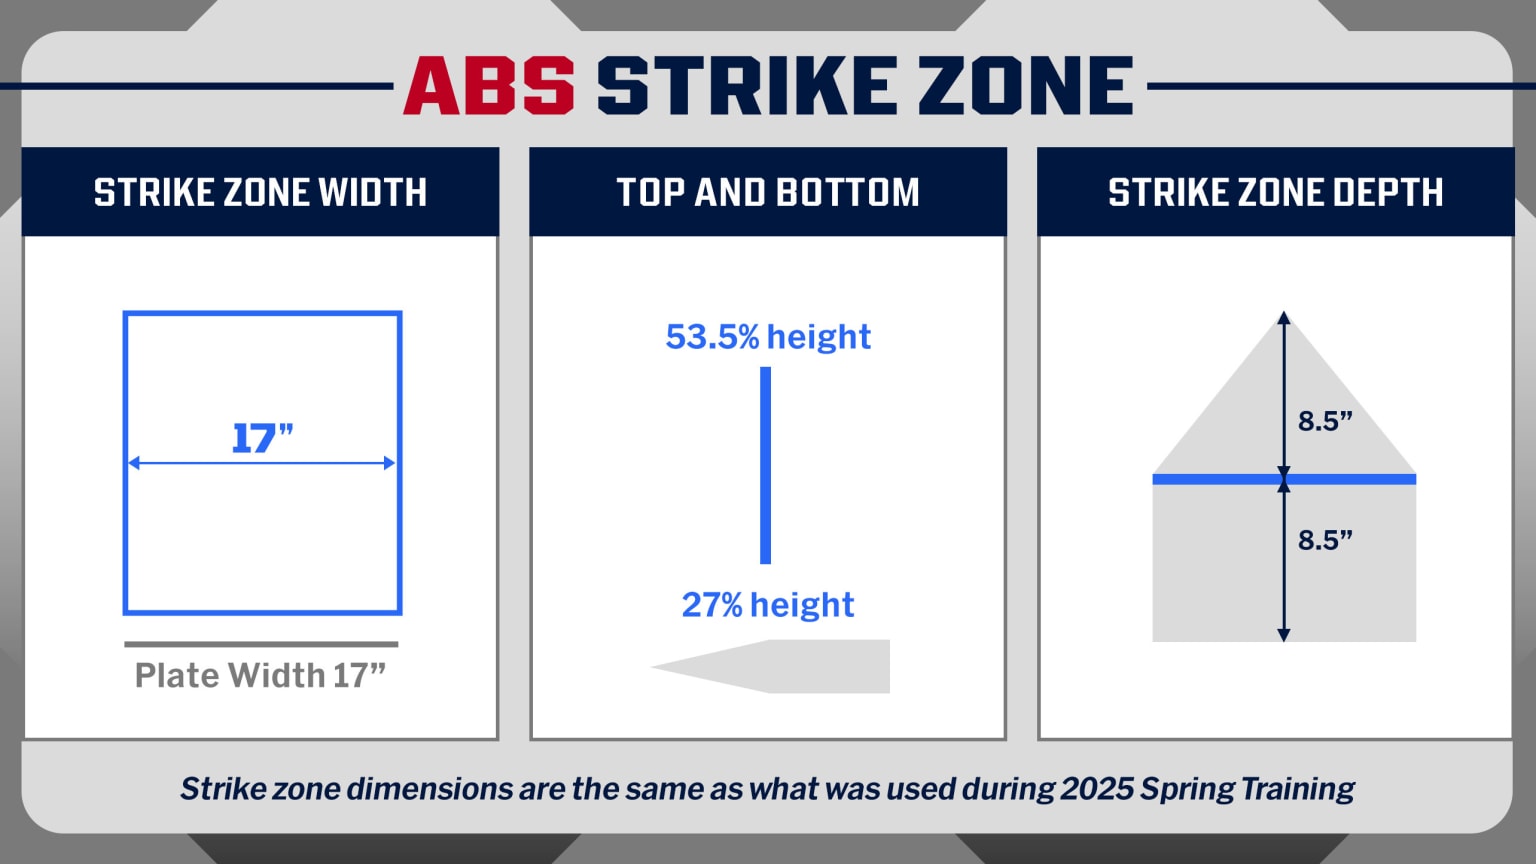
The new rule-book strike zone. Credit: MLB.
Starting this season, we are adopting the official ABS strike zone to measure the accuracy of MLB umpires. We thought long and hard about this decision, but our thinking ultimately boiled down to this: we view the introduction of ABS challenges as a formal redefinition of what a strike is. If umpires can now be overturned based on the ABS zone, then that zone is the operative definition of a strike, and our metrics should reflect that.
All data from the pre-ABS era (pre 2026) will remain unchanged and still be based on the previous strike zone method.
You can read more about our previous and new methods for determining if a pitch is a strike on our accuracy explainer page.
What this means
A few major takeaways to be aware of:
First, league-wide accuracy may tick down by a percent or two. Using historical data, our initial analyses suggest that removing the probabilistic tolerance results in an extra 1.5 pitches out of every 100 being counted as incorrect. If we grade pre-ABS umpires on the new ABS strike zone, accuracy drops another half a percent or so (though there’s already some initial evidence ABS-era umpires are adjusting to the new zone – more on this soon).
Second, comparisons over time become difficult. The obvious downside to maintaining two different accuracy models – one pre- and one post-ABS – is that umpires are graded on different scales over time. We’re open to suggestions on how to deal with this going forward.
Third, there are a number of new and exciting ABS-based statistics for us to track. ABS opens up a whole new world of possibilities: which players and teams are the best at challenging? Which umpires get challenged, and overturned the most? You can read more about the new stats we’ve implemented below.
New ABS stats
We have introduced a series of challenge related statistics to evaluate umpires, teams, and players. For umpires you can see how often they are challenged and how many of those challenges are overturned. For teams and players you can see how successful they are at challenging, as well as how good they are at deciding when to challenge or not. We have more ideas for challenge stats that we’ll be rolling out throughout the season, so stay tuned for those. You can see each of these new stats defined in our glossary.
Changes to the scorecard
First, we should note all of our umpire statistics on the scorecard and the website are based on data before challenges. We believe that umpires should still be evaluated before challenges and the data should not be influenced by whether or not they are challenged.
You will see a few changes to the scorecards. At the bottom left we’ve added the ABS data, and at the bottom right you’ll see the called ball and strike accuracy in a new form. Incorrect calls that were overturned will still show up on the graphic, but will be highlighted to indicate that they were overturned. Finally, we have added the favor after accounting for challenges for reference right below the umpire favor.